Meter Curves
Energy consumption for a Jigawatt Fusion Project–whether historical or predicted–is managed on the Meter. The system compares Meters to Layouts when modeling the solar energy offset of a PV system, so understanding the energy demand is critical to good quoting. It's not unusual, however, for a customer to not have a full year worth of utility bills. Whether they just moved in, or are so disorganized they can't seem to locate their old energy bills, there are times when you'll need to provide a good-faith estimate based on the information you have.
Extrapolating usage from known data
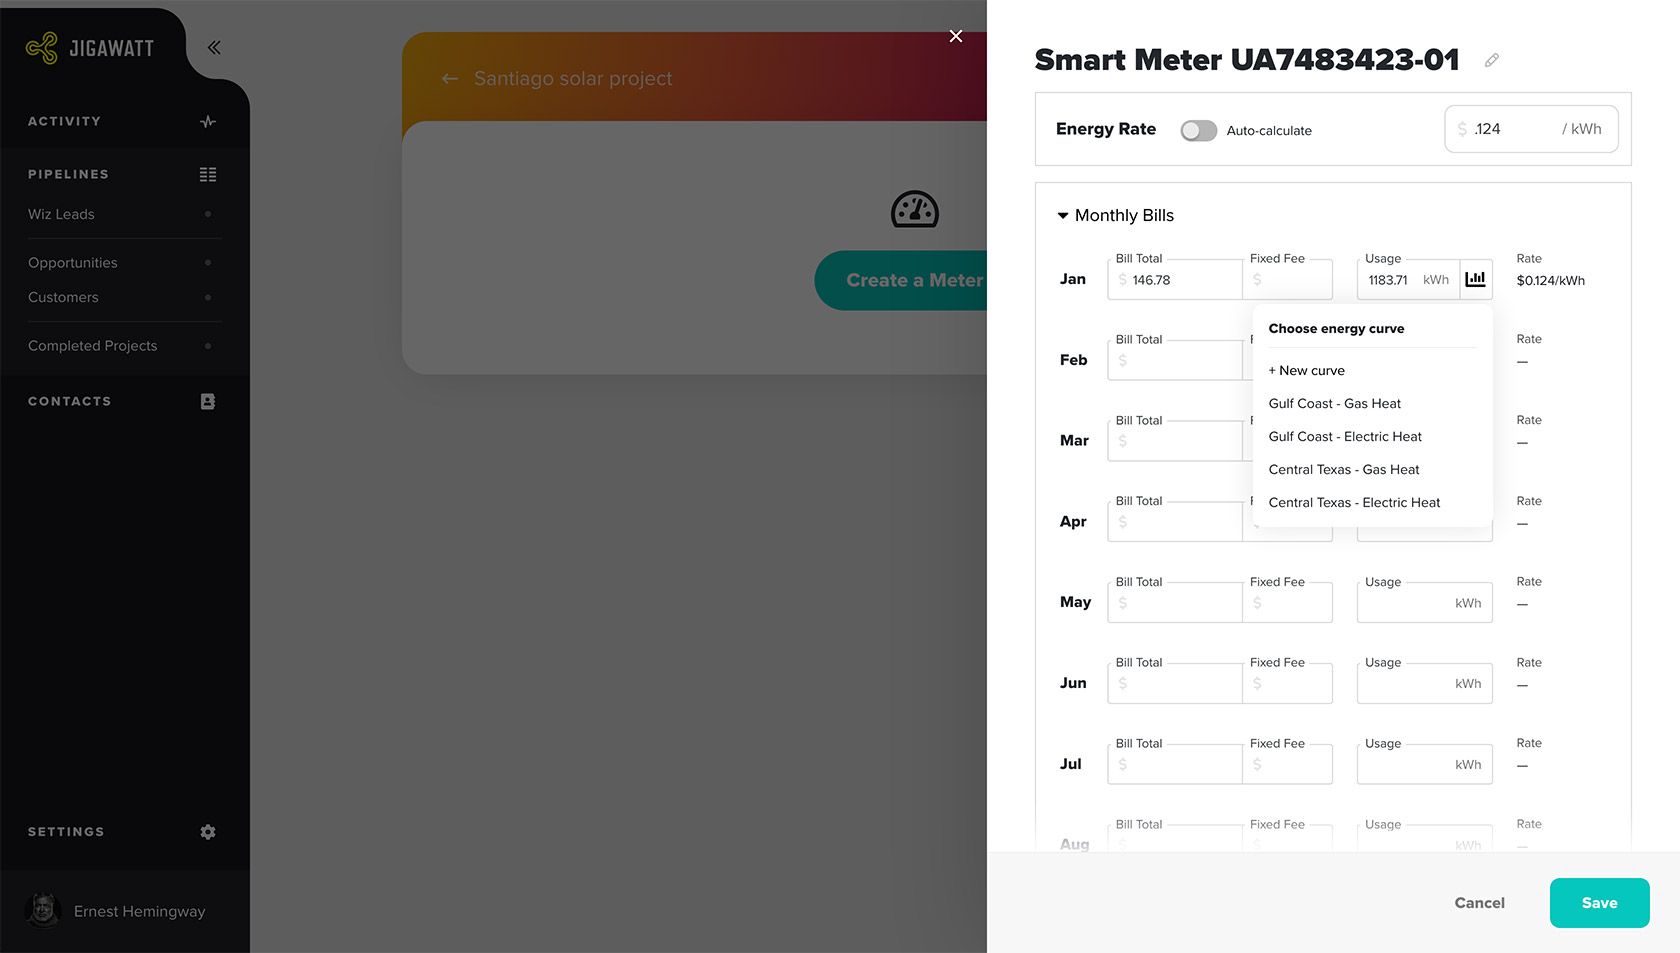
Meter Curves are extremely helpful for estimating energy usage from a few data points. When plugging historical usage into a Meter, you can extrapolate any unknown months from the ones you have bills for. Simply enter the usage in kWh for a known month, and click the button to extrapolate the empty cells from the Meter Curve of your choice.

Of course, you'll need to have a Meter Curve set up before you can extrapolate from it. You manage them in Settings > Presets > Meter Curves, where you can create as many variations as you need for your region's climate.
Meter Curves are a relative, monthly comparison
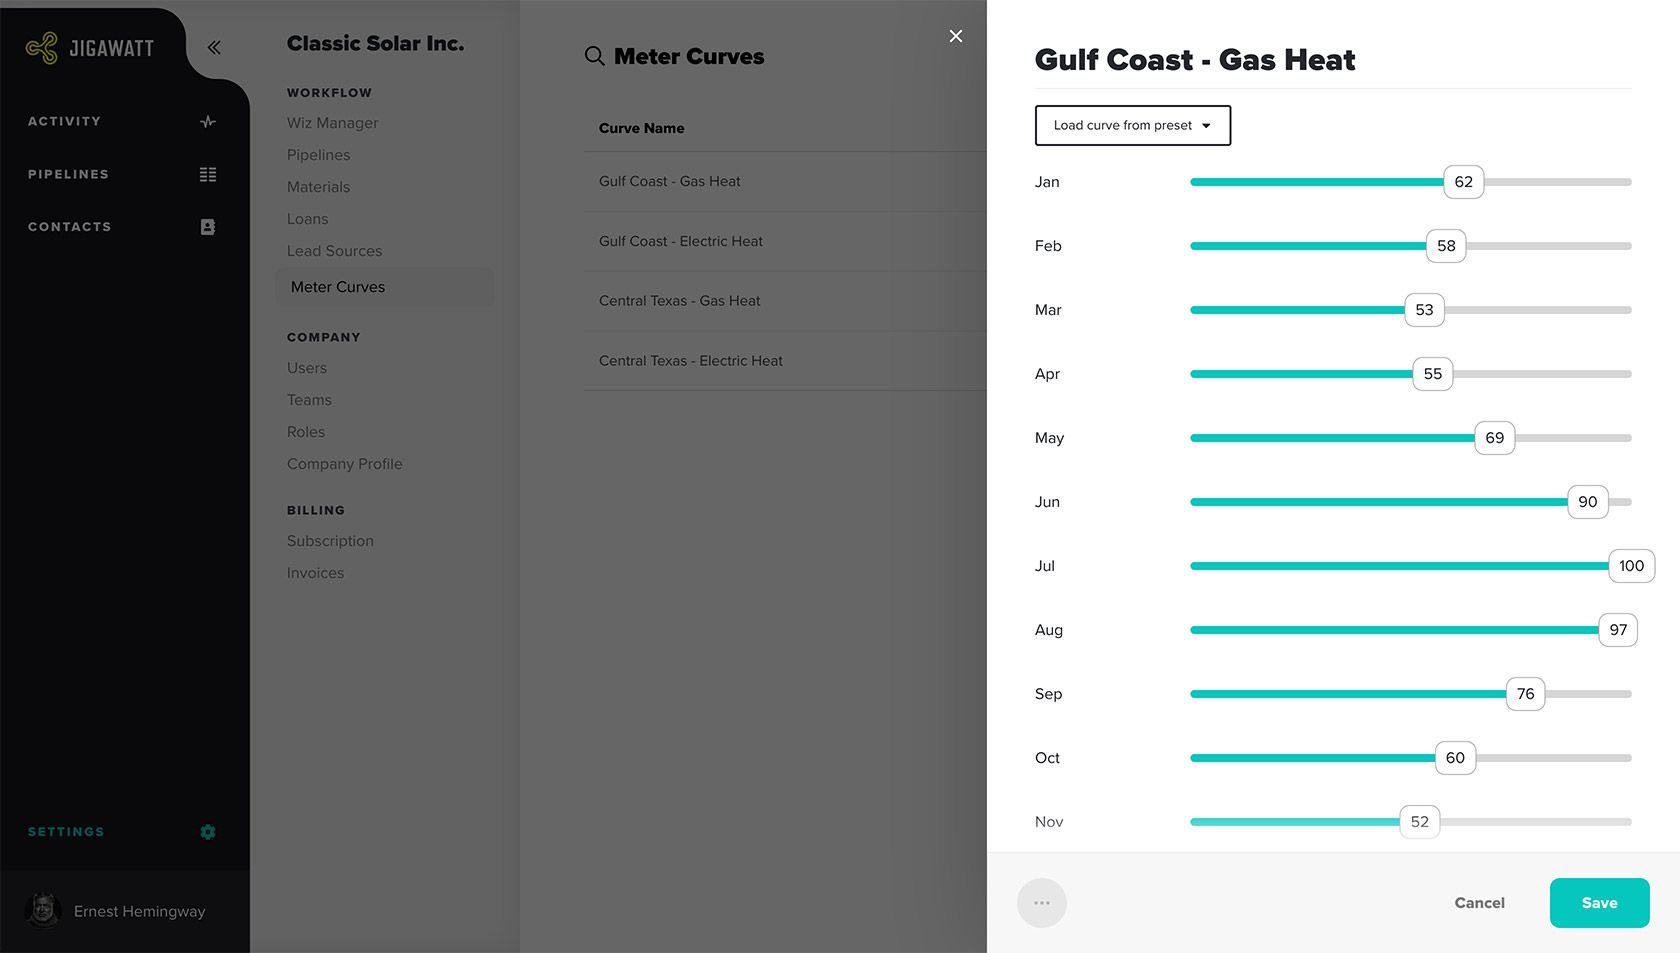
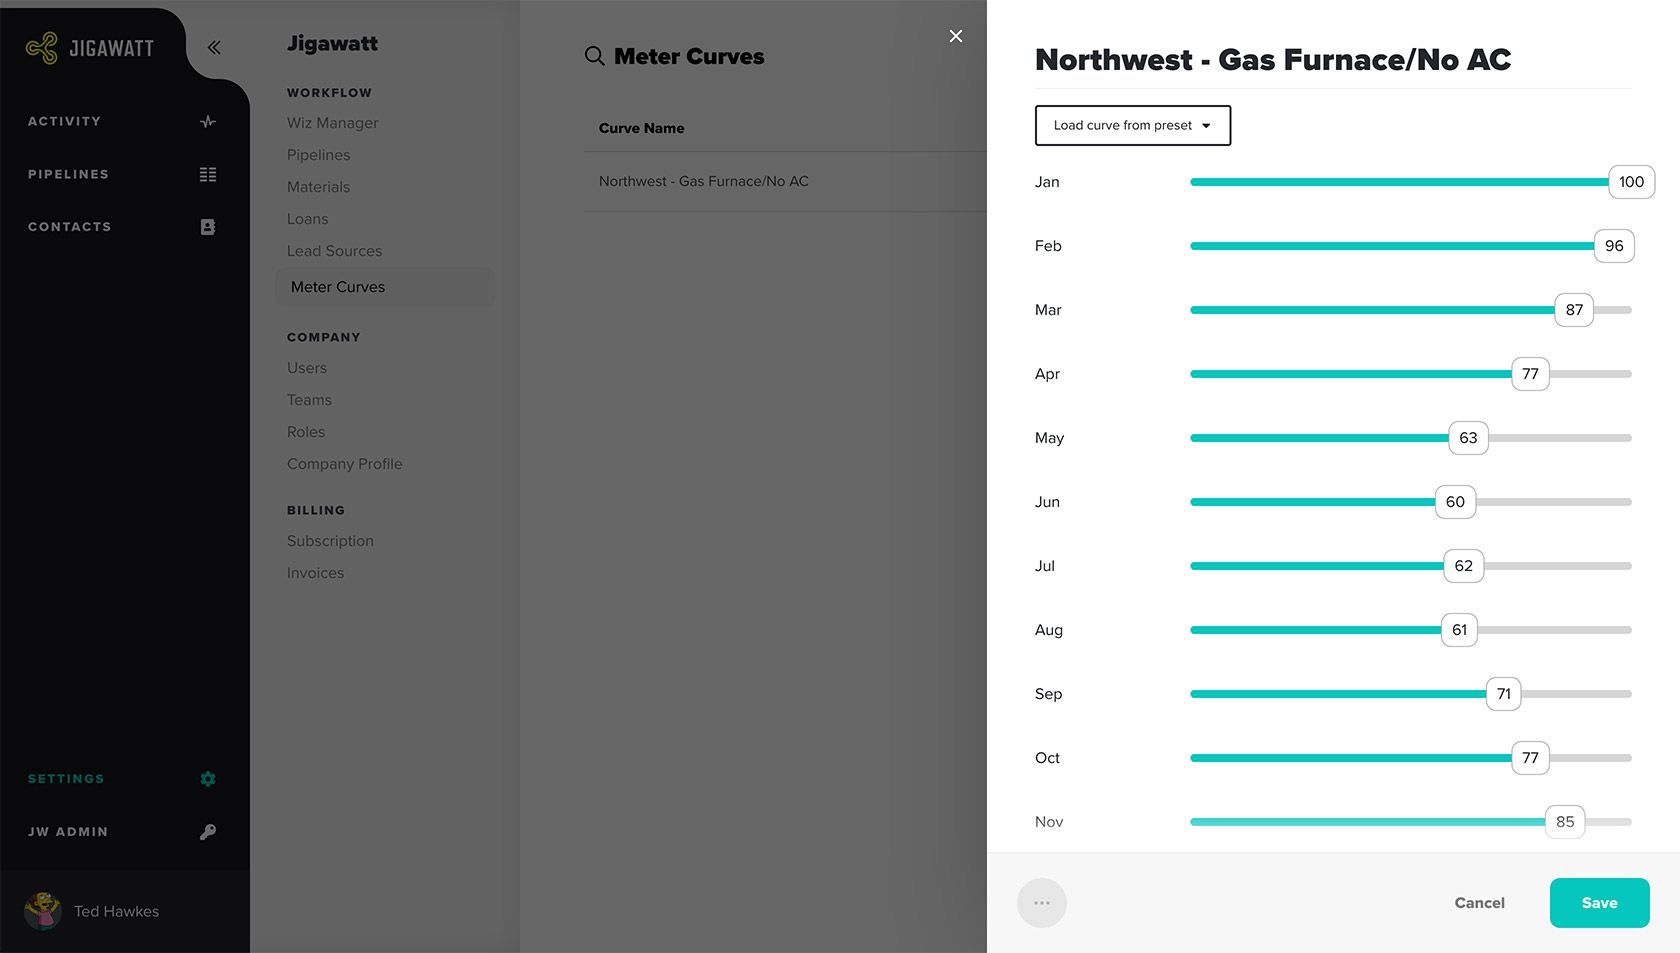
Each month in a Meter Curve is assigned a value from 0 to 100. Depending on your local climate and the HVAC systems in the building, the high-usage months could be either in the summer or winter, or both.

A house on the Gulf Coast will almost certainly have central air conditioning, and during hot summer months, demand on the AC system is at its peak. House guests during the holidays, and really bright light displays, can increase energy demand in the winter, but if a home has gas heating, electrical consumption will be much lower than in the summertime. Springtime, when the windows are open and AC is off, is generally the least energy-intensive time of year in hot climates.

A temperate zone like the Pacific Northwest, however, can have an energy usage curve that's almost the inverse of the South or Southwest. Many homes don't even have central AC, and whether the furnace is gas or electric, shorter days and indoor activities result in peak consumption in the middle of winter.
Modeling your Meter Curves
Every situation is unique. While understanding these variables' impact on energy consumption can help you form educated models, it's clearly impossible to know for certain how a household will utilize energy in the future. If a Meter Curve is used to forecast a home's energy demand, the customer should be well apprised of the methodology in order to proceed with proper expectations. A thorough understanding of the energy economy in your area–and some publicly available data from utilities and other sources–will be highly instrumental in modeling Meter Curves.
In general:
Central air conditioning is a huge summertime load.
An electric furnace results in high demand in the winter.
Good insulation and low-E windows can reduce energy consumption considerably when it's either hot or cold outside, but will have little impact during the comparatively-modest spring and fall.
LED lighting reduces load year-round, but more so when the days are shorter, and less so if the building has a lot of natural lighting.
A swimming pool can be the biggest load of all, even if it's not heated.
Jigawatt Fusion doesn't limit the number of Meter Curves a Company can utilize. You'll want to model as many as are useful to good-faith predictions, but not so many your users can't figure out which one to use in a given situation. Above all, it's always better to quote jobs based on actual energy bills than on approximations, if you can get your hands on them.